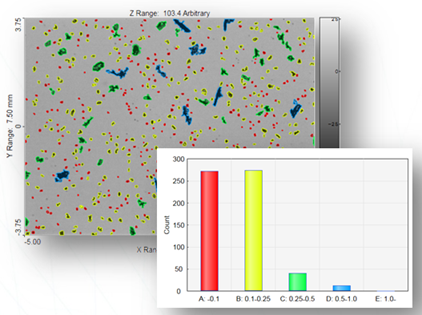
With Shape Classification in SPIP™, you can classify detected features(particle, pores, grains, cells, etc. ) into user defined classes, based on their Shape characteristics. The classes can be quantified and visualized in charts and tables in various ways. The classification can be automated as part of a batch process, and reports may be generated by use of SPIP’s Active Reporting technology.
The Classification function may be applied for different purposes: For quality assurance, it might for example be essential to know how many particles are exceeding some boundary conditions.

Example: Documentation of powder grain sizes in specific size ranges for QA purpose. Courtesy of Particle Analytical.
Within research you may often investigate different types of Shapes, which you want to group and quantify automatically.
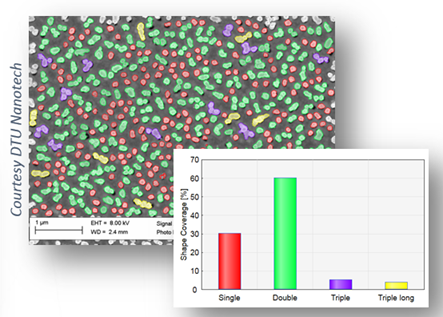
Example: Analysis and quantification of stand alone pillars versus doublets and triplets. Courtesy of DTU Nanotech.
Shape Classification is part of the Particle & Pore module. The functions are accessed from the Output tab of the Particle & Pore Analysis pane.You will get started by clicking on the Setup & Classification pull down menu and select Classifications:
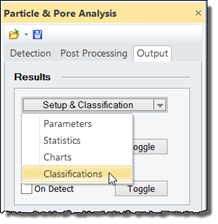
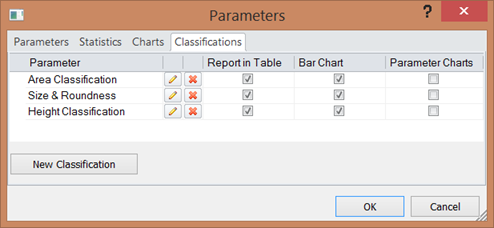
This will open the “Parameters Dialog” with the “Classifications” tab open:
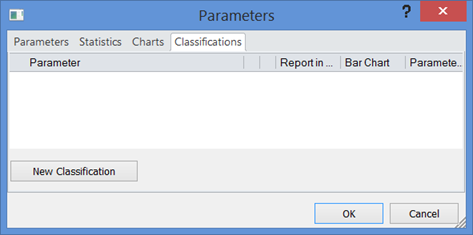
To start defining your classification click New Classification and the Classification dialog will appear. The appearance will depend on whether you already have done a Particle and Pore detection or not.
In case there are no detected Shapes the dialog will be shown as below:
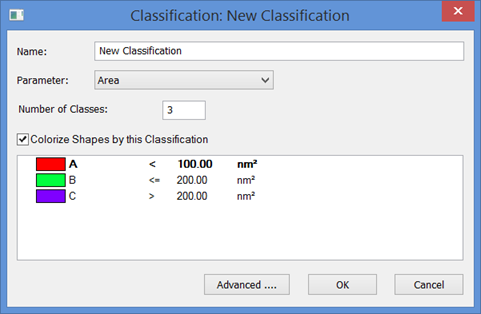

Rename each class to a desired name

In case there are detected Shapes the Classification dialog will appear with the source image having its Shapes overlaid by the colors of their associated classes as shown below. In addition, the dialog displays the histogram of the selected Shape parameter together with interactive class borderlines. An initial classification of equally space classes will be shown.
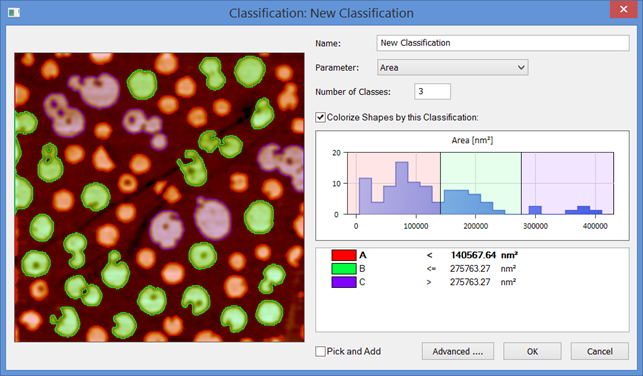
You can drag the borderlines connected to the boundary values interactively and instantly see how the classification changes the colors of the Shapes in the image. You may also make use of the “Click and Add” function for changing the class with a specific Shape:
The class boundaries will now be adjusted so that the Shape will fit just within the limit of the class (if not already). This has the effect that all Shapes will be reclassified in accordance to the new classification boundaries.
It is possible to define classes by more parameters such that you for example can distinguish large and round from large and long Shapes. To do this enter the advanced mode by clicking on the “Advanced …” button. This will reveal new buttons for defining new classes.
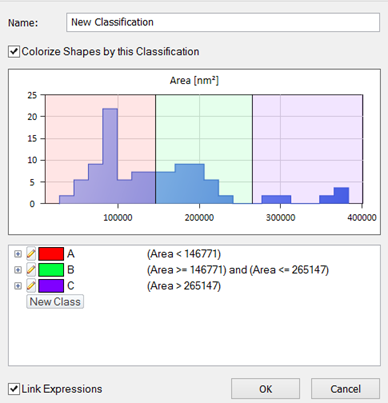
If the desire is to avoid overlapping classes, the most convenient is to split the existing classes by a different Shape parameter. This is done by clicking on the “edit pen” and selecting the Split option:
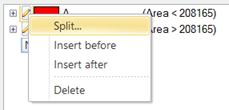
Then the “Split Class” dialog will appear where you can define the number of classes into which the existing class should be divided and which parameter should be used:
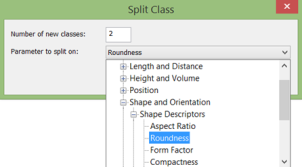
You can repeat this for the other existing classes and obtain a result as shown below where for example three distinct “Big and Round” Shapes are shown in the green color.
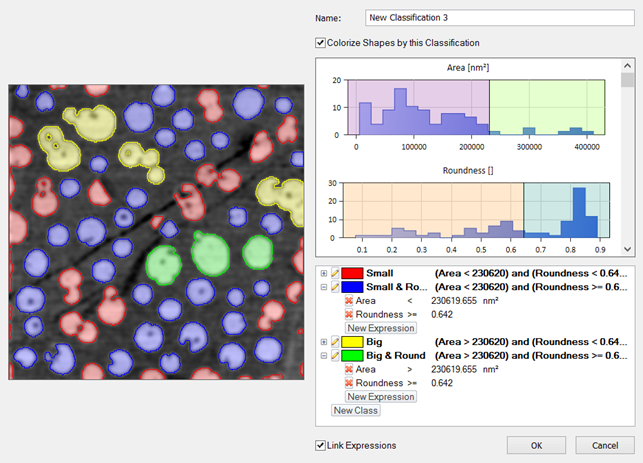
The above example was generated by a typical work flow for defining a classification on more parameters: First some "base" classes are defined in the "simple" classification dialog, then these classes are split by another Shape parameter in the "advanced" mode.
By default expressions are linked, which means that expression sharing the same boundary values will stay identical even when one of the expressions is modified. This makes it easy to avoid overlapping classes or Shapes not being classified.
In case you want to have overlapping classes (such as “Big” overlapping both “Big & Round”and “Big & non-round”) you can turn “Link Expressions” off.
When turning "Link Expressions" on again the boundary values will be linked when the boundary values in expressions become identical, either by entering equal values or by dragging a histogram borderline to the vicinity of another borderline.
In case of overlapping classes, i.e. Shapes belonging to more classes this will be indicated by a cross hatch pattern in the Shape colorization in the image.
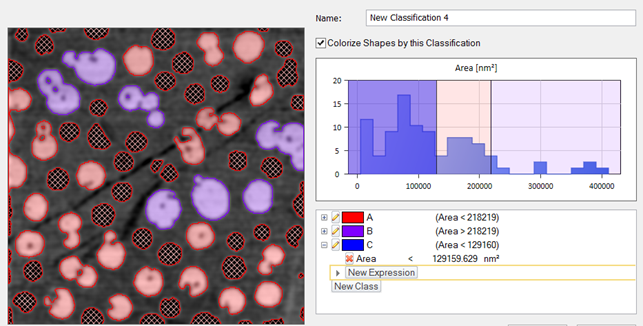
As an alternative to having overlapping classes within the same classification you can have more independent classifications performed simultaneously. This may produce more bar charts but with fewer bars in each bar chart. Of course the Shape colorization can only follow one classification at a time but you can in the "Color Settings" in the Output tab of the Particle & Pore Pane decide which classification to use:
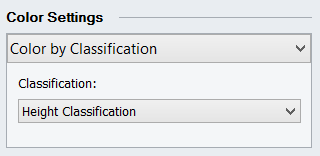
In addition to the Shape coloring, the classification results can be reported in different ways:
This is determined by the check boxes in the Classification tab of the Parameters dialog
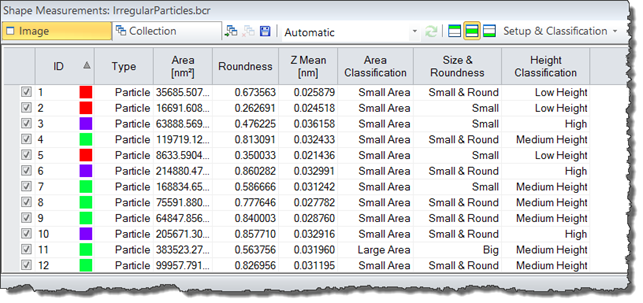
In the Shape Measurement Result Table the classification results can be shown along with the other Shape parameters. It is possible to sort the Shapes by their class names, which again makes it easy to group select specific classes and for example group delete those Shapes, - exactly as for the "normal" Shape parameters.
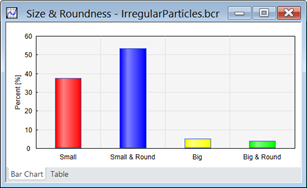
The classification result can be shown as a bar chart. The underlying numerical results are provided in the same Bar Chart Window in the "Table" tab .
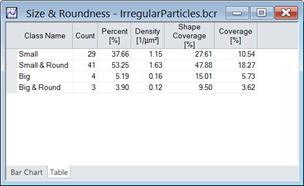
The table exhibits two coverage percentages: the “Shape Coverage” tells how much each class covers relatively to the total area of all Shapes, while the “Coverage” tells how much each class covers of the entire image area.
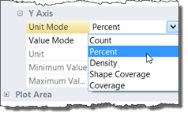
The y-axis of the chart can be modified to express the same values as shown in the table: Count, Percent, Density, Shape Coverage and Coverage (of total Image area). This is done from the View Settings of the chart:
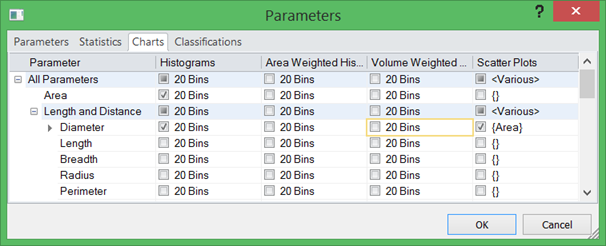
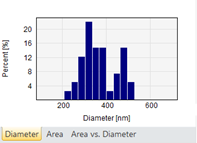
When "Parameter Charts" are turned on for a classification, any Parameter Histograms or Scatter Chart selected in the Parameters dialog will be shown for each class. Below is shown how to define histograms for the Area and Diameter parameters and a scatter plot for Area vs. Diameter. For each class a window will be shown with the requested charts in separate tabs.
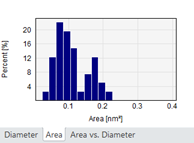
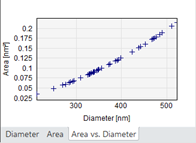
Shape classification is fully supported by Active Reporting allowing you to generate reports in MS Word and HTML formats and it is possible to define a simple batch process for particle detection, classification and reporting.
SPIP™ has a built in example report template for classification that works together with a built-in Particle & Pore settings file. To try the example do the following:
1) Load the "Particle & Pore Analysis" example image from the Welcome Screen.
2) Load the built-in Particle & Pore Analysis settings called "Particle Classification", which can be retrieved from the Particle & Pore Analysis Pane:
3) Click the "Detect" button at the bottom of the Particle and Pore Analysis Pane to perform the detection and classification.
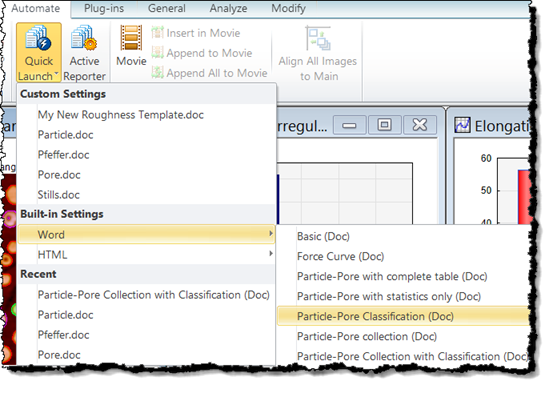
4) From the Report Quick Launch in the "Automate" tab of the Ribbon select the "Particle-Pore Classification (Doc) report template and the report will be generated.
To automate this process a two step processing sequence can be defined in the Batch Processor dialog:

Depending on your application you will need create your own Particle & Pore settings file and report template.
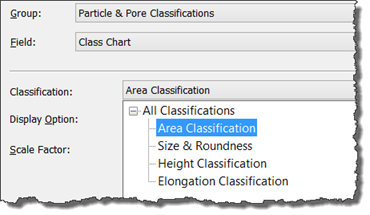
For including classification results, in an Active Report template set Group to “Particle & Pore Classifications”. Then set the Field to one of the possible charts or tables:
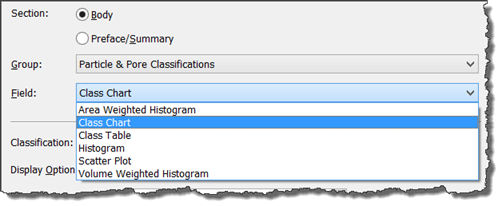
Finally select one of your defined classes for which the chart or table should be generated.
